

Highlights
- In the third quarter of 2022, nearly 61% of listing views went to homes listed in other metropolitan areas
- Viewers from the Northeast and West regions are the most likely to be searching for homes in different metropolitan areas than where they reside
- Homes in Arizona became less popular as the share of views to out-of-state homes increased (14.4 ppt Y/Y) and the share of views from out-of-state shoppers declined (-4.3 ppt Y/Y)
- Homes in Michigan became more popular as the share of views to out-of-state homes declined (-3.5 ppt Y/Y) and the share of views from out-of-state shoppers increased (17.2 ppt Y/Y)听听
In 2022Q3, 60.7% of all Realtor.com listing page views went to homes located outside the metropolitan areas where shoppers live, suggesting Americans are on the move. This was an increase of 3.8 percentage points from the second quarter of 2022 and an increase of 8.6 percentage points year-over-year.听
Figure 1: Percent of Views to Out-of-Metro Homes, U.S.
At 69% of out-of-metro views, home shoppers from the Northeast outperformed their western peers (65.7%) and became the group that are most likely to search for out-of-metro homes.听
Specifically, among the top 100 metros, the share of out-of-metro views from Chicago-Naperville-Elgin (26.8 ppt), New York-Newark-Jersey City (23.2 ppt), Washington-Arlington-Alexandria (18.2 ppt), Phoenix-Mesa, Scottsdale (14.8 ppt), Atlanta-Sandy Springs-Roswell (14.7 ppt) and Los Angeles-Long Beach-Anaheim (12.8 ppt) all increased at double digit rate year-over-year.听
Figure 2 : Percent of Views to Out-of-Metro Homes by Regions

States that lost popularity from local home shoppers (Outbound views)
Table 1 shows the top five states where the share of views to out-of-state listings grew the most year-over-year in 2022Q3. An increase in the outbound view share means that the home state is relatively less popular among its residents, either because more of them are looking to move away from their home states or because fewer households are shopping locally for real estate.
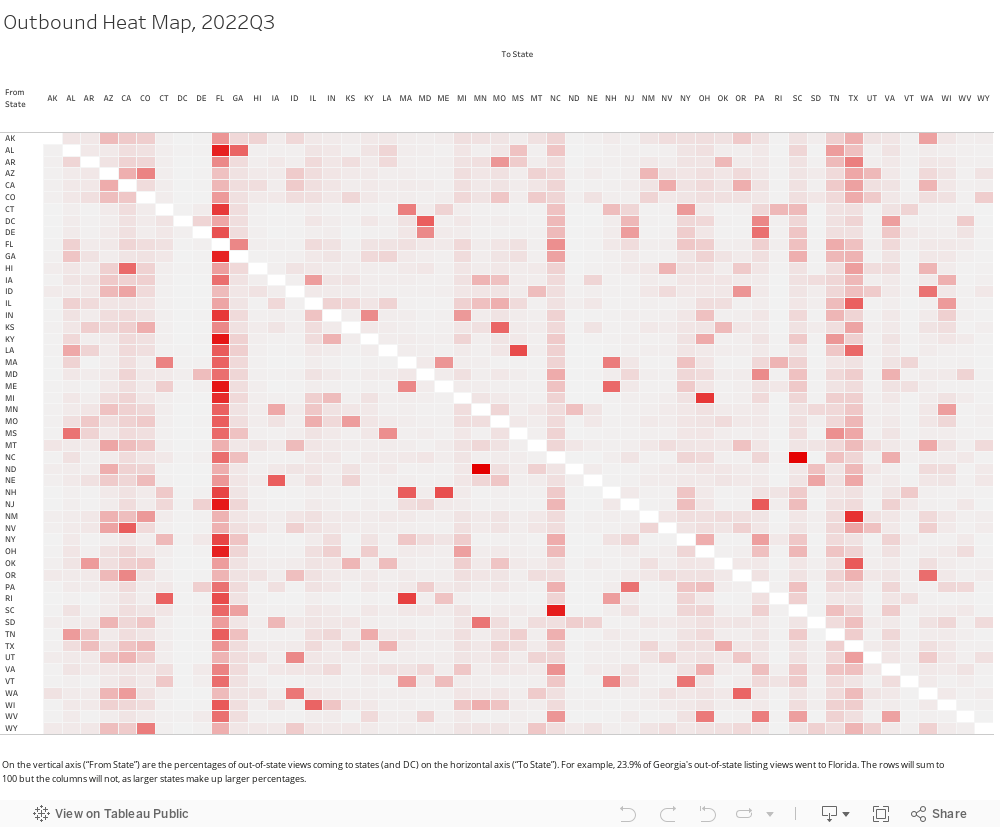
Similar to last quarter‘s findings, interest in out-of-state homes grew the most among shoppers in New York, Virginia, Illinois, Georgia, and Arizona. When looking for out-of-state homes, shoppers from New York, Virginia and Georgia showed the highest interest in moving to Florida. Shoppers from Illinois searched most often in Texas, and Arizona shoppers viewed homes in Colorado more than elsewhere. See the Outbound Views-Heat Map below for a more detailed breakdown of out-of-state viewership.听
Table 1: States that lost popularity from local shoppers
|
|
Share of Outbound Views to Other States (2022Q3)听 | Share of Outbound Views听 to Other States (2021Q3)听 | YY |
| New York | 68.8% | 37.4% | 31.4 ppt |
| Virginia | 73.1% | 44.2% | 28.9 ppt |
| Illinois | 65.8% | 39.0% | 26.8 ppt |
| Georgia | 62.8% | 47.0% | 15.8 ppt |
| Arizona | 53.4% | 39.0% | 14.4 ppt |
Interestingly, home searching patterns in all these five states have reversed compared to a year ago. In 2021Q3, the outbound view shares from these states were all below 50%, suggesting local shoppers prefer to stay within their home states. However, in 2022Q3, view shares to other states dominated the search patterns, showing rising preferences for living in other states. Specifically, it is the first time that Arizona home shoppers have shown stronger interest in out-of-state properties than within-state ones in our data history.听
States that lost popularity from out-of-state shoppers (Inbound views)
Table 2 shows the top five states where the inbound share of views from other states declined the most or grew the least year-over-year. When a state has a low or negative change in the inbound traffic share, it means the state becomes relatively less popular among out-of-state shoppers than local home shoppers.
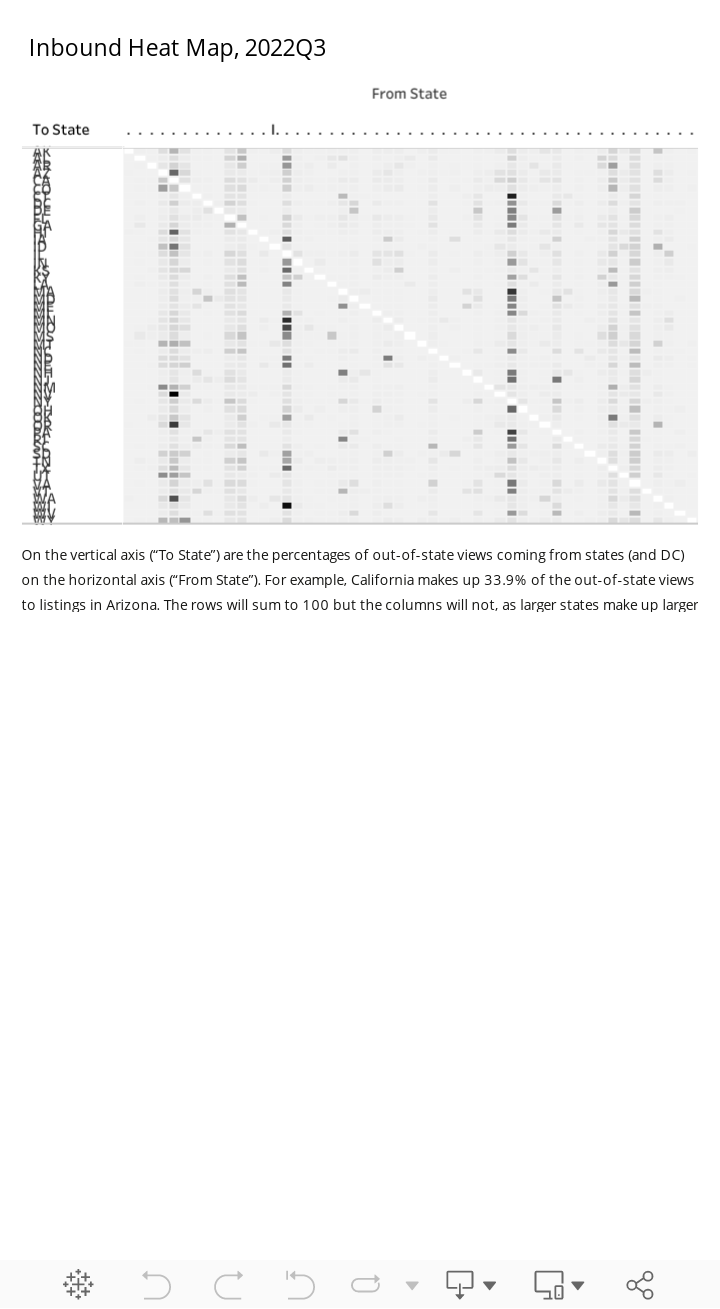
Arizona and California were the only states that lost popularity among out-of-state shoppers compared to last year. While this is not the first time that inbound view shares to Arizona experienced decline, it is the largest magnitude we have observed in our data history. In 2022Q3, views from California made up 33.9% of out-of-state traffic to Arizona, 4.4 percentage points lower than a year ago. For a more detailed breakdown of which states are driving demand in others, see the Inbound Views-Heat Map below.
Table 2: States that lost popularity from out-of-state shoppers
| Share of Inbound Views from Other States听 (2022Q3)听 | Share of Inbound Views from听 Other States (2021Q3)听 | YY | |
| Arizona | 40.8% | 45.1% | -4.3 ppt |
| California | 14.8% | 15.1% | -0.3 ppt |
| Alaska | 66.5% | 65.5% | 1.0 ppt |
| Hawaii | 70.0% | 68.8% | 1.2 ppt |
| Illinois | 20.3% | 18.7% | 1.6 ppt |
Homes in Arizona lost most popularity听
Arizona seems to be a less desirable destination state for both local听 (Table 1) and out-of-state home shoppers (Table 2) in 2022Q3 compared to last year. Our finding aligns with the median listing price trend shown in Figure 3. Year-over-year median list price growth in Arizona had outpaced the national average until July 2022, suggesting relatively lower demand in recent months.听
Figure 3 : Median Listing Price, YOY
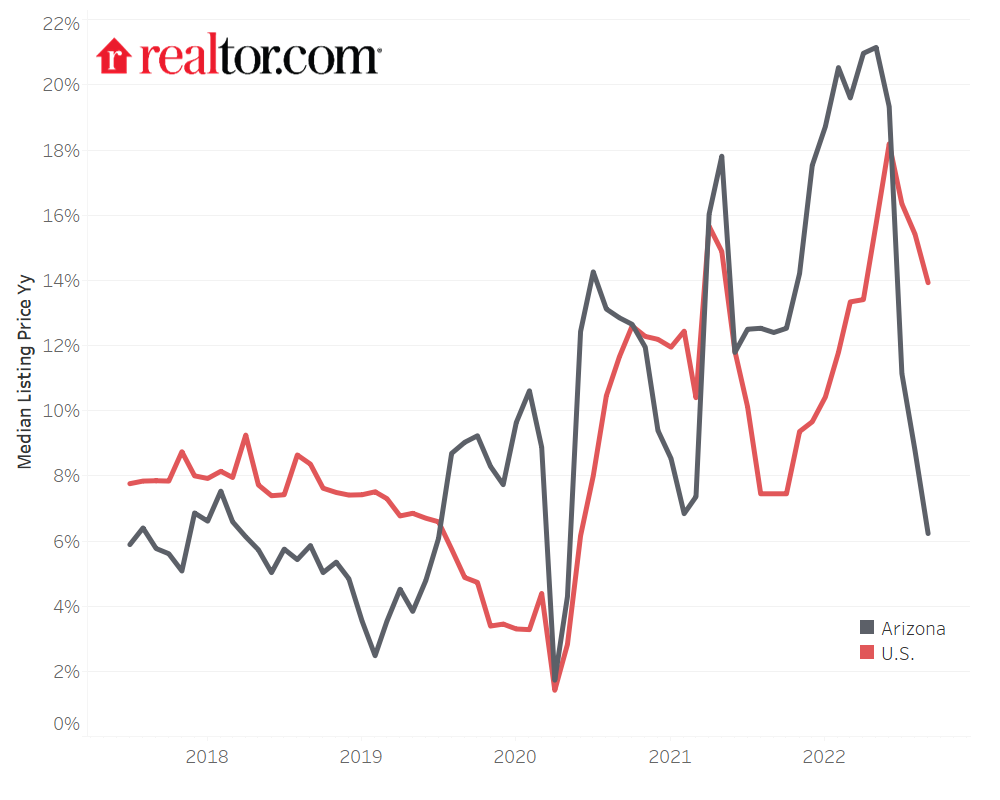
One possible explanation behind this decreasing popularity could relate to climate risks. Realtor.com鈥檚 recent research has shown that climate risks influence people鈥檚 buying decisions. The recent long-lasting in the western region brought temperatures to all-time highs, and may have cooled off people鈥檚 eagerness to search for homes in Arizona during this period. Another potential reason could be the rising living costs. In August 2022, inflation hiked to in the Phoenix metro (vs. 8.3% nationwide), the highest record in any U.S. metropolitan area going back 20 years. Looking at all the expenditure categories, shelter costs were the primary driver of the skyrocketing inflation in the Phoenix area ( in vs. national average ). Our listing data also shows that Arizona homes are losing their price advantage. Back in September 2018, the median listing price per square foot for a typical home in Arizona was 13.9% higher than the national average ($164 vs. $144), but the difference was more than doubled in September 2022, expanding to $48 ($268 vs.$220), 21.8% higher than the national average.听
States whose shoppers were less interested in other states (Outbound views)
Table 3 shows the top five states where the share of views to out-of-state listings declined the most year-over-year in 2022Q3. Shoppers from Washington, New Jersey, Michigan, Utah, and Kentucky showed the largest declining interest in out-of-state homes. In addition, Michigan had the lowest outbound traffic share in 2022Q3, as only one-fifth of views went to out-of-state listings. In other words, nearly 4 of every 5 shoppers from Michigan are shopping for a home in Michigan.听
Table 3: States whose shoppers were less interested in other states
| Share of Outbound Views to Other States (2022Q3)听 | Share of Outbound Views to Other States (2021Q3)听 | YY | |
|
Washington |
48.4% | 64.3% | -15.9 ppt |
|
New Jersey |
33.0% | 40.7% | -7.7 ppt |
| Kentucky | 27.9% | 31.6% |
-3.7 ppt |
| Michigan | 23.0% | 26.5% |
-3.5 ppt |
| Utah | 44.1% | 47.0% |
-2.9 ppt |
States that gained popularity from out-of-state shoppers (Inbound views)
Table 4 shows the top 5 states in which the share of views from shoppers living in other states grew the most year-over-year, suggesting these states have become more popular among non-resident shoppers. Notably, three out of five states are located in the Midwest, where housing tends to be relatively more affordable which has helped propel metros in the Midwest to the top of Realtor.com鈥檚 September Hottest Housing Markets list as well. In addition, in 2022Q3, the primary traffic sources were reversed in Nebraska and Iowa for the first time in our data history, meaning that for the first time since 2017, Nebraska and Iowa had more out of state shoppers than local shoppers.
Table 4: States that gained popularity from out-of-state shoppers
| Share of Inbound Views from听 Other States (2022Q3)听 | Share of Inbound Views from听 Other States (2021Q3)听 | YY | |
|
Nebraska |
50.5% | 31.9% | 18.6 ppt |
|
Alabama |
63.2% | 45.4% |
17.8 ppt |
| Michigan | 38.7% | 21.5% |
17.2 ppt |
| Iowa | 56.9% | 40.1% |
16.8 ppt |
| Maryland | 47.1% | 31.6% |
15.5 ppt |
Homes in Michigan gained most popularity听
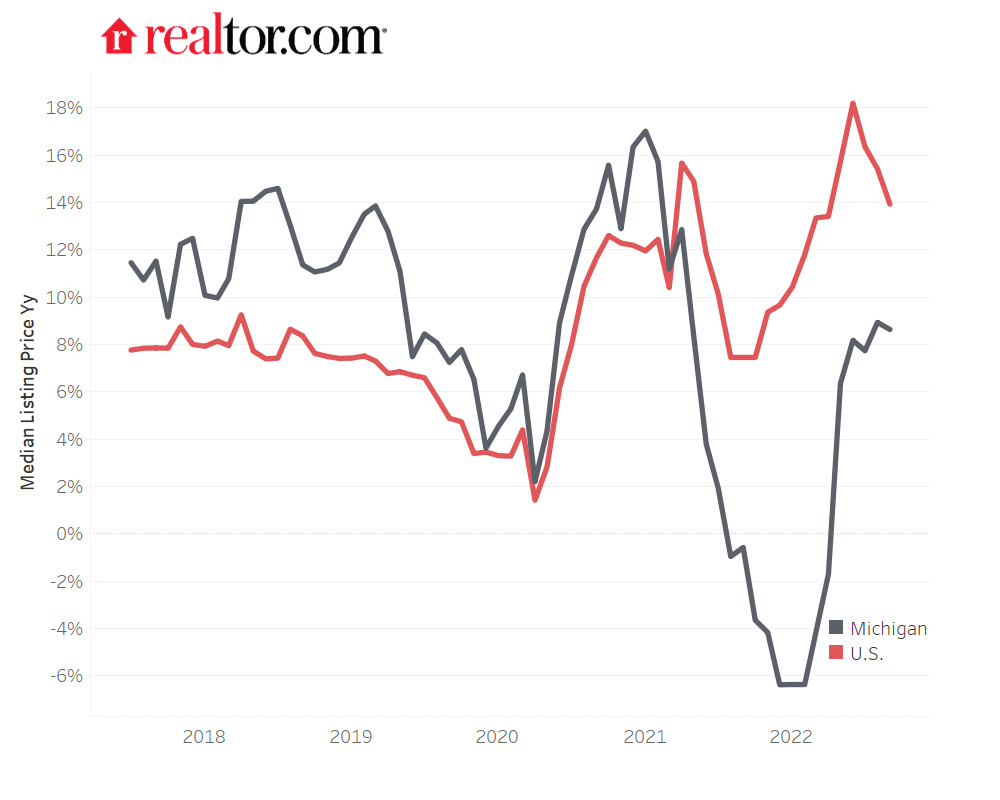
Michigan has become a more desirable destination state for both local (Table 3) and out-of-state home shoppers (Table 4) in 2022Q3 compared to last year. Our finding aligns with the median listing price trend shown in Figure 4. While the year-over-year growth rate across the nation cooled from 16.4% to 13.9% in the third quarter, the rate in Michigan exhibits a different trend, rising from 7.7% to 8.6%, suggesting stronger demand in recent months.听
One potential reason for people moving to or staying in Michigan could be a search for greater affordability. In September 2022, the median listing price for Michigan was $269,000, 37% lower than the national average, while the estimated 2022 median household income in Michigan was only 10.1% lower than the national average.听
Figure 4 : Median Listing Price, YOY
Methodology
This report analyzes views of for-sale listings on the Realtor.com marketplace in the U.S. 50 States and District of Columbia. Share of outbound views (i.e. out-of-metro views and out-of-state views) are quoted as percentage of views originating from home metros or states to other metros or states. Share of inbound views (i.e. views from out-of-state shoppers) is quoted as the percentage of views to a state coming from other U.S. states.
Note: The Q3 analysis focuses on domestic views from metro areas only, and thus the percent of out-of-metro views will not match previously-published reports/releases in which international and non-metro views were included. Information on inbound views from international home shoppers can be found via our Cross-Market Demand Dashboard.
Subscribe to our mailing list to receive monthly updates and notifications on the latest data and research.