
Highlights
- Manchester-Nashua, NH was once again the country’s hottest housing market in May, topping the list for the nineteenth time in the data’s history.
- The top 20 hottest markets are spread out across 11 states, with four metros in Connecticut and three in Massachusetts.
- As price growth continues to slow nationwide, affordability remains a feature of the majority of May’s hottest markets.
- Only the Northeast and the Midwest were represented on this month’s hottest market list. The Northeast was represented by 13 markets while the Midwest boasted 7.
- The Chicago metro area saw the largest increase in its hotness ranking among larger metros compared to last year, climbing 110 spots to rank as the 126th hottest US market in May.
Manchester-Nashua, New Hampshire ranked as May’s hottest housing market. This is the 19th time in the metro’s history that Manchester-Nashua has ranked as the nation’s hottest market. The first time Manchester-Nashua topped the list was in September 2020 and it has remained in the top 20 since February 2020.��
Realtor.com’s Market Hotness rankings take into account two aspects of the housing market: 1) market demand, as measured by unique views per property on Realtor.com, and 2) the pace of the market as measured by the number of days a listing remains active on Realtor.com.
Relative Affordability Remains Important for Constrained Buyers
Overall, 12 of May’s hottest markets had median listing prices below the national median. The lowest priced market, Rockford, IL, had a median listing price of $189,000, 57.3% lower than the country’s May median listing price of $441,000. The average listing price for the 20 hottest markets climbed compared to last month as pricey Northeast markets joined the list, including the Boston and Bridgeport-Stamford-Norwalk metros. The average listing price of the top 20 markets was $462,000 in May, 4.7% higher than the national median.��
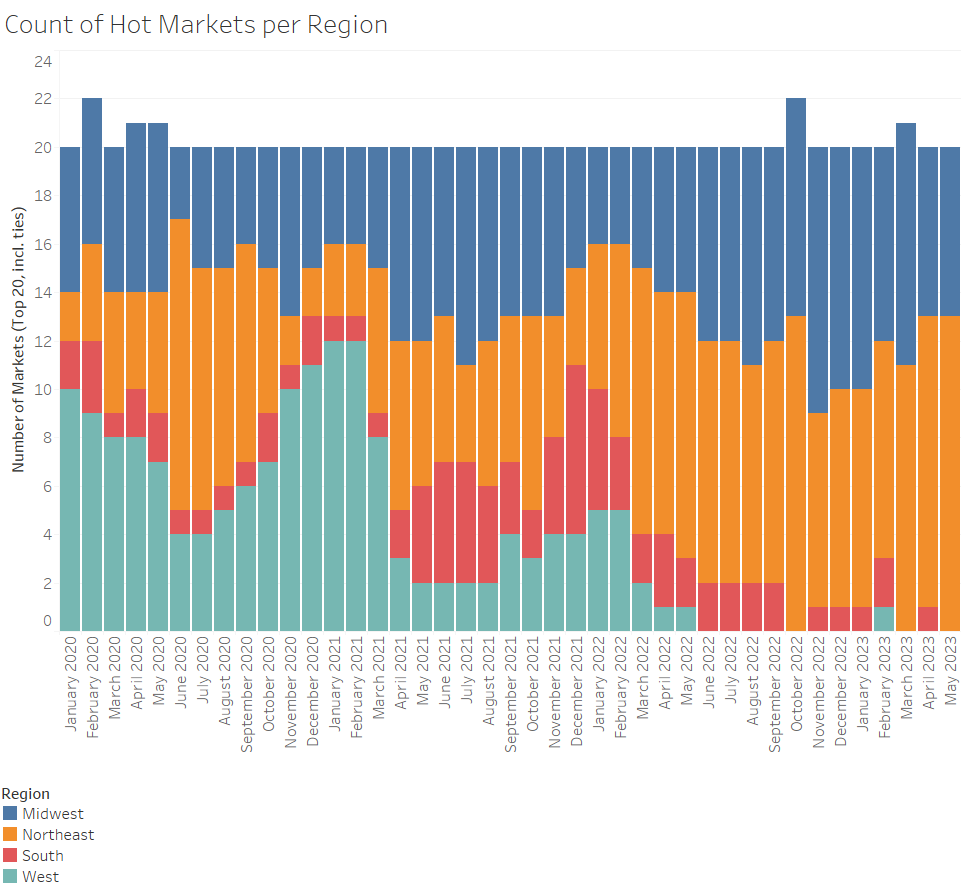
The Northeast and Midwest were the only regions represented on this month’s list. Northeast metros on the Hottest Markets list garnered an average 2.7 times the number of views per property as the typical US home while hot Midwest metro listings received 2.3 the number of views as was typical in the US. The hottest markets included four locales from Connecticut, three from Massachusetts and two each from Wisconsin, Ohio, New Hampshire, and Maine. One metro was featured from each Vermont, New York, Missouri, Indiana and Illinois.The oft-featured Hartford, CT, and Worcester, MA metros stand out as these markets are also featured on the Top Markets Forecast for 2023 as markets that were expected to have top sales and home price performance in 2023.��
Ten of the thirteen Northeast markets on this month’s list are clustered together, generally surrounding the Boston area and traveling down towards the New York City area. Both Massachusetts and the larger New England area boast strong employment conditions, outpacing the US in employment growth over the last year. High housing demand and tight inventory keeps upward pressure on prices and as a result, buyers are looking further afield for affordability in the region. The Concord, Manchester-Nashua, Portland, and Worcester metro areas all border the Boston metro area, which is also on this month’s list, emphasizing the demand to be near this Northeast hub. These metros are bordered by the hot markets of Springfield, MA, New Haven, CT, Norwich, CT, Hartford, CT and Bridgeport, CT. All together, this 10 metro cluster emphasizes the level of demand in the New England area. The other three hot Northeast metros were Burlington, VT, Rochester, NY and Bangor, ME. The number of active listings fell year-over-year in most of the hot Northeast metros as new listing activity failed to keep up with demand.
Affordable Midwest metros held 7 spots on this month’s list. The average listing price for these midwestern markets was $317,000, 28.2% below the national median, but an average 14.0% higher than one year ago for the markets included. Wisconsin and Ohio each have 2 markets on the list, while Missouri, Indiana and Illinois each have one. All of the Midwestern markets on the list were priced below the national median and garnered an average 2.3 times the number of views as the typical US listing. On average, homes in these Midwestern markets spent more than 2 weeks less time on the market than was typical in May in the US.
Our Hottest Housing Markets, by design, are the areas where homes sell fastest and have lots of potential buyers checking out each listing, suggesting relatively favorable conditions for sellers. As a group, Realtor.com’s 20 Hottest Housing Markets received 1.7 to 3.7 times the number of viewers per home for sale compared to the national rate. These markets are seeing homes-for-sale move up to 32 days more quickly than the typical property in the United States. Because homes in the hottest markets move fast, shoppers in these areas should be aware of conditions and have their finances in order, including a mortgage pre-approval, so that they can submit an offer quickly if they find a home that is a good fit.��
High Demand and Climbing Prices in Hottest Markets as Summer Approaches
The late spring housing market may be sluggish nationally, but May’s hottest markets are still seeing high demand and a quick pace of sale. Listing viewership in the hottest markets was an average of 2.6 times the typical level in the US in May, emphasizing the sustained popularity of these hot markets relative to the full US market. Homes in the hottest markets attract a greater-than-typical number of home shoppers, with a larger difference between the national market and the hottest market than was common in the years before the pandemic. The key takeaway for buyers and sellers here is that while national real estate trends are an important context, these trends can drive activity towards or away from certain markets, so local demand may be quite different from national demand.
While inventory has increased 21.5% relative to last May at the US-level, all of the hottest markets have seen either slower inventory growth or even inventory decline. On the low side, Hartford, CT has seen inventory decrease 25.4% year-over year. This relatively low inventory growth is the result of high demand, coupled with lagging rates of new listing activity. This combination leads to short time on market, driving hot market status.��
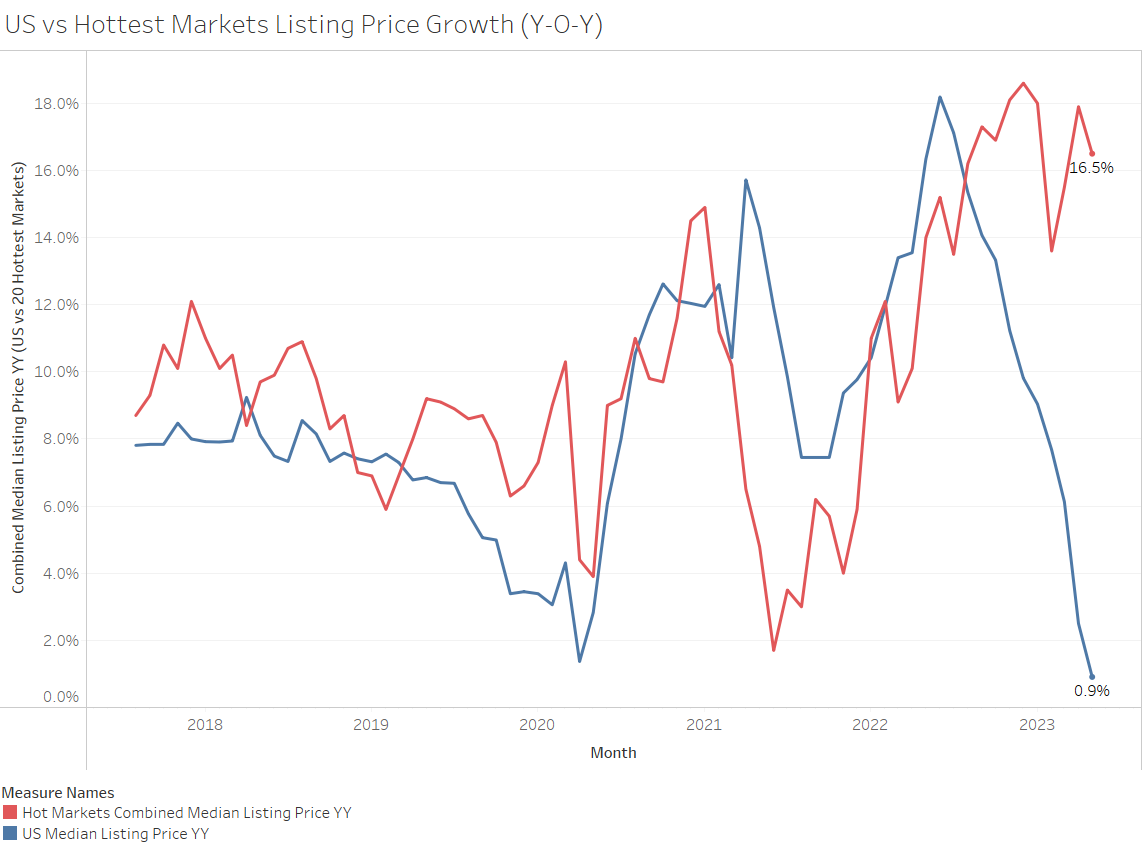
The median national home price for active listings climbed to $441,000 in Mayl, with price growth slowing to 0.9% year-on-year. The majority of May’s hottest markets are relatively affordable markets that fall below the national median price, despite seeing price growth that outpaces the national rate. On average, these hot markets have seen prices increase by 16.5% year-over-year, far higher than the national rate of price growth. May is the tenth month in a row that the average hottest markets’ price growth climbed beyond US price growth, which has been falling since June. The wide-ranging search for affordability is driving relatively high price growth in otherwise affordable locales, a trend consistent with greater interstate home shopping observed in the Realtor.com Q1-2023 Cross Market Demand Report.
Price per square foot growth mirrored the median listing price trends in the hottest markets. Price per square foot growth in this month’s hot markets outpaced US growth, though the price was lower than the US median. The average hot market price per square foot was 7.9% lower than the typical US price in May, up an average 9.4% compared to last May, outpacing the US’ -0.3% price per square foot growth.��
May 2023 – Top 20 Hottest Housing Markets
| Hottest Metros | Hotness Rank | Hotness Rank YoY | Viewers per Property vs US | Median Days On Market | Days on Market YoY | Median Listing Price If Active Within Period |
| Manchester-Nashua, N.H. | 1 | 0 | 3.1 | 11 | 3 | $523,000 |
| Concord, N.H. | 2 | -4 | 3.2 | 14 | 0 | $526,000 |
| Hartford-West Hartford-East Hartford, Conn. | 3 | -4 | 3.7 | 19 | 4 | $425,000 |
| Rochester, N.Y. | 4 | 2 | 2.9 | 13 | 3 | $265,000 |
| Portland-South Portland, Maine | 5 | 1 | 3.2 | 24 | 10 | $623,000 |
| Springfield, Mass. | 6 | -3 | 2.6 | 19 | 3 | $383,000 |
| Columbus, Ohio | 7 | 4 | 2.7 | 22 | 11 | $394,000 |
| New Haven-Milford, Conn. | 8 | -6 | 2.7 | 24 | 7 | $431,000 |
| Worcester, Mass.-Conn. | 9 | -1 | 2.3 | 19 | 5 | $517,000 |
| Rockford, Ill. | 10 | -27 | 2.3 | 21 | -3 | $189,000 |
| Burlington-South Burlington, Vt. | 11 | 6 | 2.3 | 24 | 14 | $490,000 |
| Lafayette-West Lafayette, Ind. | 12 | 2 | 2.2 | 22 | 8 | $334,000 |
| Bangor, Maine | 13 | -46 | 2.4 | 29 | 3 | $276,000 |
| Dayton, Ohio | 14 | -43 | 2.2 | 27 | 4 | $235,000 |
| Bridgeport-Stamford-Norwalk, Conn. | 15 | -10 | 2.1 | 26 | 6 | $1,198,000 |
| Appleton, Wis. | 16 | -135 | 2.5 | 30 | -14 | $397,000 |
| Eau Claire, Wis. | 17 | -14 | 2.3 | 30 | 7 | $382,000 |
| Norwich-New London, Conn. | 18 | 1 | 2.8 | 31 | 12 | $500,000 |
| Jefferson City, Mo. | 19 | -19 | 1.8 | 28 | 3 | $287,000 |
| Boston-Cambridge-Newton, Mass.-N.H. | 20 | 1 | 1.7 | 23 | 8 | $867,000 |
Boston Area Mainstays Continue Their Reign, New Midwest Markets Make the List
The Manchester-Nashua metro area was once again the country’s hottest market this month. Last month’s top market Concord, NH took the second slot, continuing the region’s sweep of the top of the list. These Boston-adjacent hotspots saw high demand and quick market pace. Manchester-Nashua homes garnered more than 3 times the number of views per listing as was typical nationally. Homes in Manchester-Nashua spent just 11 days on the market on average, more than a month less than was typical in the US in May.��
While the Northeast markets on May’s list were relatively familiar, two Midwest markets stood out as newcomers. Appleton, WI joined the list at number 16, ranking as one of the nation’s hottest markets for the second time in the data’s history. Eau Claire, WI also joined the list, taking the 17 spot and ranking within the top 20 for the first time in the data’s history. These markets both garnered more than twice the number of views per property than was typical in the US. Homes typically spent a month (30 days) on the market in both Appleton and Eau Claire, roughly two weeks less than nationally. Homes in these markets were relatively affordable relative to the US in May, with median listing prices of $397,000 and $382,000 in Appleton and Eau Claire, respectively.
Most Improved Large Markets
Larger urban markets heated up this month, with the largest 40 markets across the country getting 10 ranks hotter, on average, since May 2022. Large markets have heated up over the last couple months as more companies bring their employees back into the office. These large markets pulled in roughly the same number listing views on average than was typical in the US in May, and homes spent 6 days fewer on the market compared to the US.
In line with overall hottest market trends, all five of the most-improved large housing markets were in the Midwest: Chicago, IL (+110 spots), Milwaukee, WI (+97 spots), Minneapolis, MN (+95 spots), St. Louis, MO (+84 spots), and Cleveland, OH (+74 spots). Most of these markets offered highly sought-after affordability, with listing prices as much as $204,000 below the national median in Cleveland. Minneapolis, however, was priced 4.2% above the national median.��
The Chicago, IL housing market saw the fastest May hotness growth in the metro’s data history, earning it the position of fastest-rising large market. In the first quarter of 2023, this metro received 7.3% of its out-of-metro attention from viewers within the New York City metro according to Realtor.com Cross-Market Demand data. Bargain shopping may have been on the minds of those movers. The median listing price in the New York City metro was $735,000 in May, nearly twice as much as Chicago’s $376,000 median home listing price in the same month. In May, the Chicago area rose 110 spots in hotness rank compared to last year. The metro area clocked in as the 126th hottest metro in the US. Homes in Chicago typically spent 34 days on the market in May, 9 days fewer than the typical US home. On the demand side, properties in the metro garnered roughly the same number of viewers as the typical US property.��
On the supply side, the five most-improved large markets saw inventory spend 33 days on the market, roughly a week more than last May but 10 days faster than the typical US home. In comparison, the largest 40 markets overall saw properties spend roughly 13 days more time on the market than last year, on average.��
Markets Seeing the Largest Jump in Rankings (May 2023)
| Metro | Hotness Rank | Hotness Rank YoY | Viewers per Property vs US | Median Days On Market | Days on Market YoY | Median Days On Market Vs Us |
| Chicago-Naperville-Elgin, Ill.-Ind.-Wis. | 126 | -110 | 1 | 34 | 6 | -9 |
| Milwaukee-Waukesha-West Allis, Wis. | 34 | -97 | 1.5 | 29 | 4 | -15 |
| Minneapolis-St. Paul-Bloomington, Minn.-Wis. | 99 | -95 | 1.03 | 31 | 7 | -13 |
| St. Louis, Mo.-Ill. | 87 | -84 | 1.37 | 37 | 7 | -7 |
| Cleveland-Elyria, Ohio | 72 | -74 | 1.65 | 38 | 5 | -6 |
Note: With the release of its February 2023 Housing Report and Data, Realtor.com® incorporated a new and improved methodology for capturing and reporting housing inventory trends and metrics. As a result of these changes, this release is not directly comparable with previous data releases and reports. However, future data releases, including historical data, will consistently apply the new methodology.��