

Our research team releases regular monthly housing trends reports. These reports break down inventory metrics like the number of active listings and the pace of the market. In addition, we continue to give readers more timely weekly updates, an effort that began in response to the rapid changes in the economy and housing as a result of the COVID-19 pandemic. Generally, you can look forward to a Weekly Housing Trends View on Thursdays with a from our economists on Fridays. Here’s what the housing market looked like over the last week.
What this Week’s Data Means:
Soaring mortgage rates have fueled competition in housing markets this week. Buyers rushed to get in before rates moved even higher while selling interest continued to lag year ago levels, leading to a higher pace of home price growth and bigger annual drop in time on market than we saw last week. In addition, the number of homes actively available for sale remains at all-time lows at least in part because builders have not kept up with household growth over the last decade.
Because the buying power boost that low interest rates provided during the last two years is fading, affordability will become a top consideration for many buyers and may eventually slow demand. And if the housing supply gap continues to expand, limited housing inventory will worsen the affordability double trouble in housing markets. Fortunately, the gap in new listings relative to last year decreased notably this week. We’ll watch this indicator closely in the weeks ahead to see if more homeowners are deciding to sell, as our recent homeowner survey suggested they would.
Key Findings:
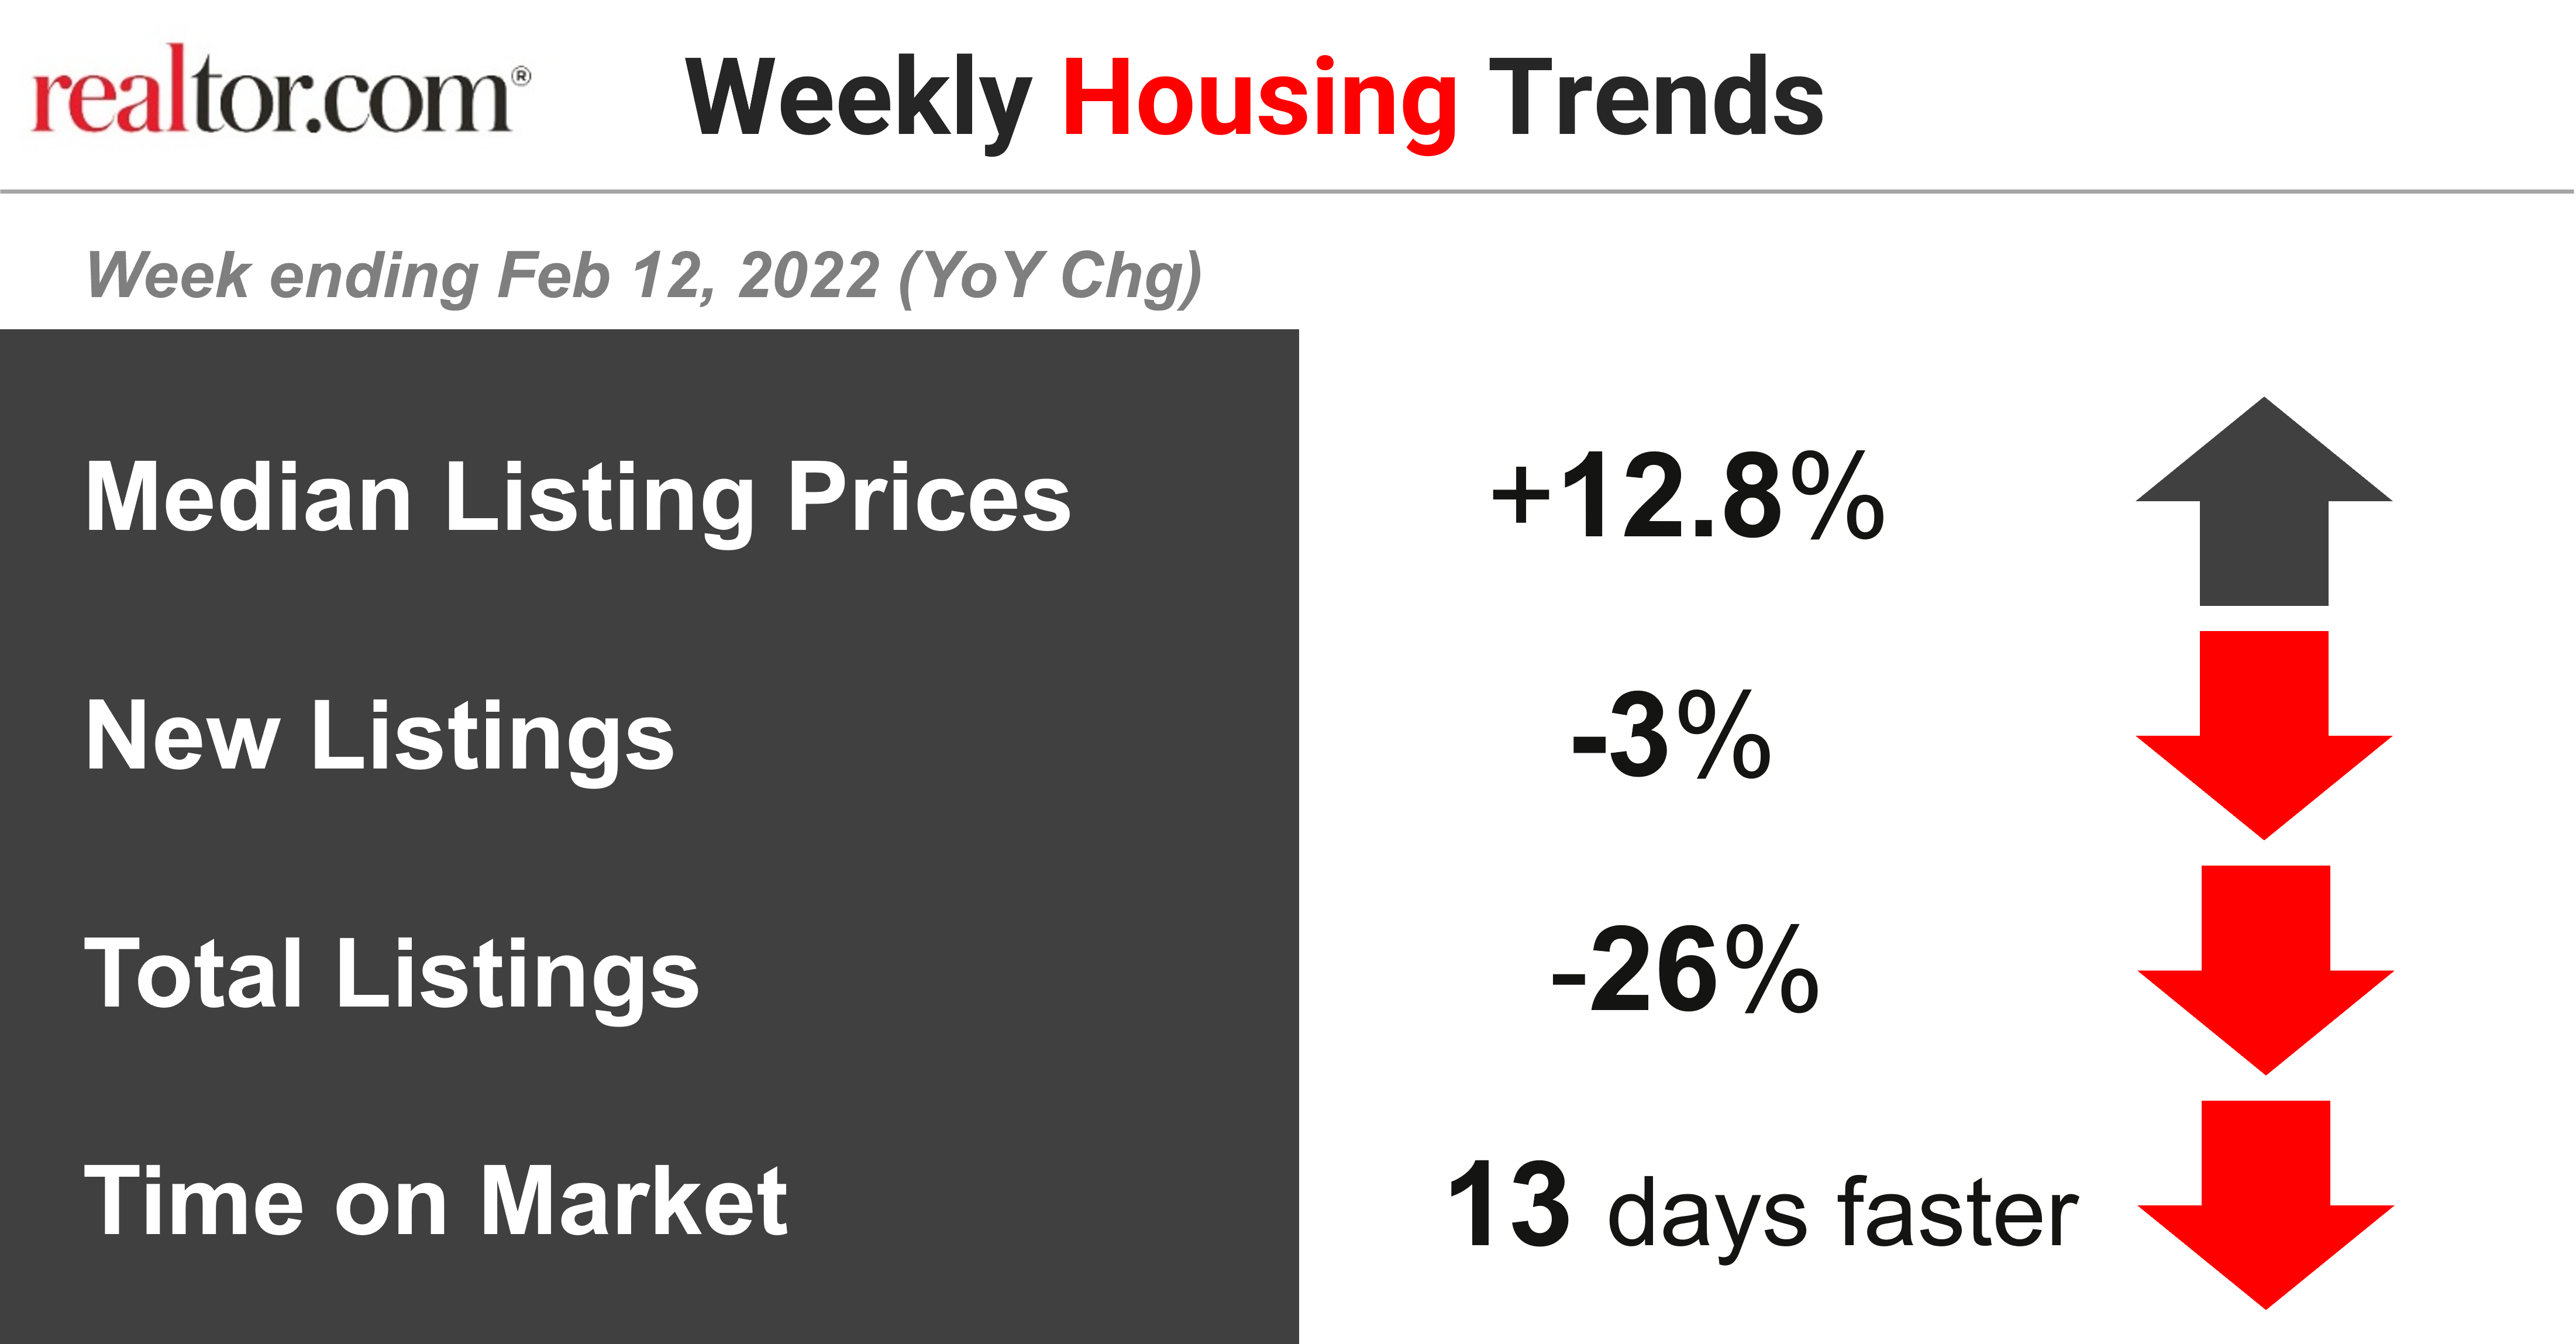
The median listing price grew by 12.8 percent over last year.Ěý
After a period of steady 8.5 to 9.0 percent growth in the fall, the median listing price for homes ratcheted back up to a double-digit pace in December. In 2022, not only has price momentum held, so far it has increased. The Freddie Mac fixed rate for a 30-year loan Mortgage rates hit 3.69% last week, the highest rate since January 2020. ĚýAs mortgage rates begin to rise, and are expected to continue to increase, shrinking housing affordability has become a primary concern for more buyers. Our 2022 Housing Forecast expects a slowdown in home price growth to low-single digits for the year as higher rates reduce homebuyer purchasing power, but the median list price hasn’t yet moved in that direction.
New listings–a measure of sellers putting homes up for sale–were down 3 percent from last year.Ěý
In a housing market short on inventory, new home listings are a key indicator for future home sales. They indicate the number of sellers putting homes up for sale, in other words fresh supply. New listings finished 2021 on a somewhat weaker note and have trended below previous year levels for 10 of the past 12 weeks. While still declining, the pace has improved from -15% at the start of the year to -3% this week. New listings relief is essential given that our recent analysis of U.S. housing supply shows that the gap between household formation and single-family home construction grew in the last year, even as construction hit multi-year highs.
Active inventory is down 26 percent from a year ago.Ěý
With fewer new listings added this week, buyer interest kept outpacing new selling, and we still see a sizable gap in the number of homes actively for sale relative to last year. Although a smaller number of homes for sale creates challenges for buyers and sellers–many of whom will also be buying a home–it reflects solid buyer demand given an added sense of urgency by rising mortgage rates. The soaring mortgage rates have driven a rush on new home sales as buyers try to sign contracts to lock in rates and beat further cost increases even as pending contracts on existing home sales have been held back by limited inventory.
Strong buyer interest drives time on market down 13 days from last year.Ěý
With fewer homes for sale now than this time last year, homes are selling faster and successful buyers have to move quickly. For context, a typical home spent just 61 days on the market in January, faster than any pre-pandemic year’s January. This market can be especially challenging for first-time buyers who may hesitate to contend. This can be especially true of black Americans who, in addition to contending with various forms of discrimination, often have lower incomes, and thus a smaller set of affordable homes to
Data Summary:
| All Changes year-over-year | Year-to-Date 2022 | Week ending January 29, 2022 | Week ending February 5, 2022 | Week ending February 12, 2022 |
| Median Listing Prices | +11.3%Ěý | +11.8% | +11.9% | +12.8% |
| New ListingsĚý | -9%Ěý | -7% | -7% | -3% |
| Active ListingsĚý | -28%Ěý | -28% | -27% | -26% |
| Time on Market | 10 days fasterĚý | 12 days faster | 10 days faster | 13 days faster |
Note: With the release of its January 22, 2022 weekly housing trends report, Realtor.com® incorporated a new and improved methodology for capturing and reporting housing inventory trends and metrics. The new methodology uses the latest and most accurate data mapping of listing statuses to yield a cleaner and more consistent measurement of newly listed homes. As a result of these changes, the newly listed homes data released since January 2022 will not be directly comparable with previous data releases (files downloaded before January 2022) and Realtor.com® economics blog posts. However, future data releases, including historical data, will consistently apply the new methodology.
Subscribe to our mailing list to receive updates on the latest data and research.